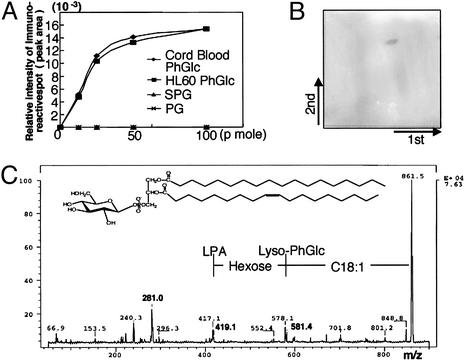
Fig. 2.
Occurrence of PhGlc in HL60 cells. (A) rGL-7 reacts with antigens from both cord RBCs and HL60 cells. PhGlc obtained from umbilical cord RBCs and HL60 cells (≈12.5–100 pmol) was separated via TLC, and spots were visualized through sequential incubation with biotinylated rGL-7, horseradish peroxidase-conjugated avidin, and the chromagen Ni-intensified DAB. Immunoreactive spots were measured by a dual wavelength TLC scanner (Shimadzu CS-930). The peak areas were plotted against amounts of PhGlc applied. (B)A single immunoreactive spot arose from the PBA-retained fraction from HL60 cells. PhGlc-containing spots were visualized by using the same method described in A.(C) Secondary ion mass spectrometry–collision-induced dissociation spectrum of PhGlc from HL60 cells. The immunoreactive spot shown in B was transferred onto a PVDF membrane and subjected to secondary ion mass spectrometry–collision-induced dissociation mass spectrometric analysis.

