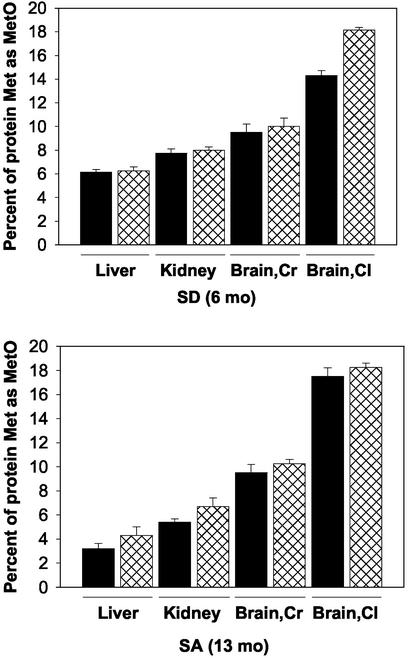
Fig. 3.
MetO accumulations in various tissues of mice fed with SD or SA diet. Protein-bound MetO levels were analyzed according to the procedure described in Materials and Methods. Solid bars and cross-hatched bars represent WT and MT, respectively. Proteins from five mice were used for each analysis. SD (6 months) or SA (13 months) represents mice at age 6 or 13 months fed the SD or SA diet, respectively. Brain,Cr and Brain,Cl represent cerebrum and cerebellum, respectively.

