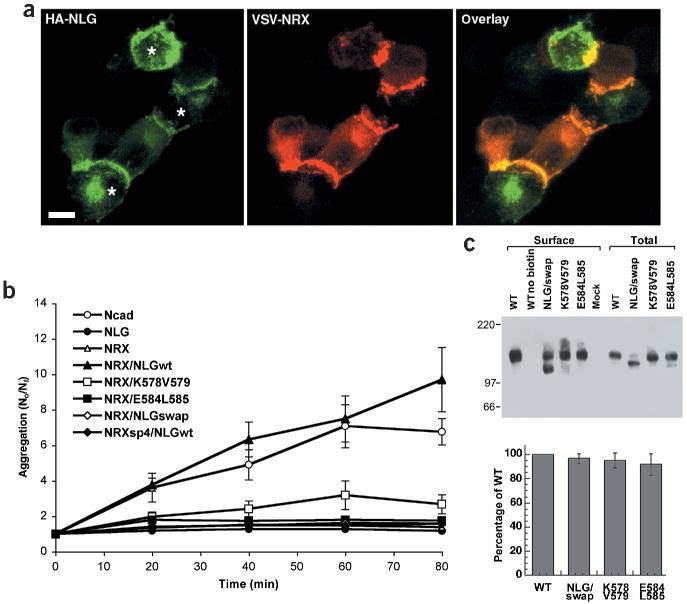
Figure 2.
Inactive neuroligin mutants are impaired in neuroligin/neurexin mediated cell adhesion. (a) Aggregates of HA-tagged neuroligin-1 expressing cells (green) and VSV-tagged neurexin-1β expressing PC12 cells (red) show localization of neuroligin-1 and neurexin at cell contacts. The asterisks indicate three HA–neuroligin expressing cells forming contacts with adjacent VSV–neurexin expressing cells. Scale bar is 7 μm. (b) An aggregation index N0 (number of particles at time 0) divided by Nt (number of particles at time t) was determined after 0, 20, 40, 60 and 80 min of incubation. Mutants E584A/L585A and K578A/V579A both showed a significant loss of aggregation with neurexin-1β expressing cells. NRXsp4 indicates neurexin-1β with an insertion at site 4 that abolishes the binding to neuroligin. (c) Surface expression of wild-type neuroligin-1 and neuroligin mutants. Western blots of an aliquot of the total cell lysates and the surface biotinylated neuroligin proteins are shown. The biotin-modified NLG/swap reproducibly showed an aberrant migration on SDS-PAGE; the lower band is most likely due to proteolytic cleavage that occurred during the isolation of the biotinylated protein. In the graph, means and standard errors of the mutant neuroligin protein levels at the cell surface are compared to wild-type neuroligin surface levels (n =4 independent experiments). See Supplementary Fig. 2 online for additional data.

