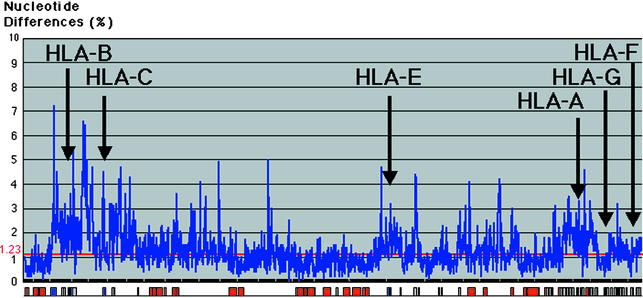
Fig. 4.
Diversity profile between human and chimpanzee MHC. The aligned sequence (excluding indels) is shown along the horizontal axis and the percent nucleotide differences calculated per 1 kb of nonoverlapping windows are shown along the vertical axis. The relative positions of the coding (red box), noncoding (gray box), and MHC (blue box) sequences are shown along the horizontal axis.

