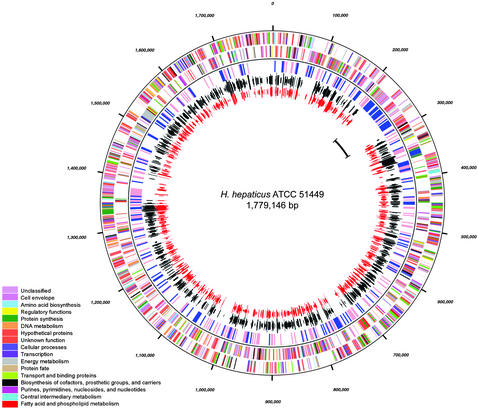
Fig. 1.
Circular representation of the H. hepaticus genome. From the outside to the inside, the first two circles represents the positions of coding sequences transcribed in clockwise and anticlockwise direction, respectively. The colors represent the functional categories of the encoded proteins, as shown in the color legend. The third circle depicts areas of the chromosome where the G+C content is >5% higher (pink) or lower (blue) than the average G+C content (window size = 2000). The fourth and fifth circles represent genes with orthologs in H. pylori (black) and C. jejuni (red). The length of the lines representing the orthologs is proportional to the percentage of amino acid identity. The position of the HHGI1 genomic island is marked in the innermost circle.

