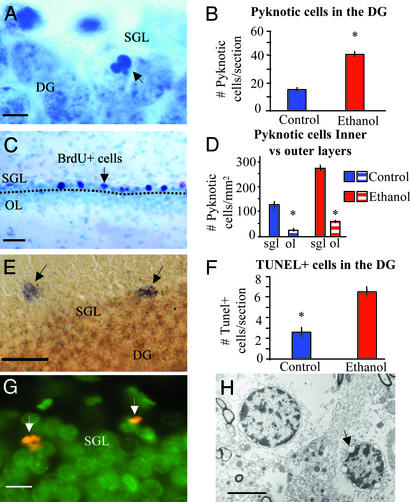
Fig. 4.
Ethanol exposure increases cell death in the DG. (A) Photomicrograph of Nissl-stained coronal section of rat hippocampus. Arrow shows pyknotic nucleus in the basal granular layer where precursors are located (6-week survival). (B) Counting of pyknotic nuclei shows a marked increase in the DG of such figures in ethanol-fed rats (40.75 ± 2.9 pyknotic nuclei per DG section, n = 4) as compared with controls (14.67 ± 1.38, n = 4). P ≤ 0.01, Mann–Whitney test (6-week survival). (C) BrdUrd-labeled section of the DG counterstained with Nissl, 6-week survival. Dotted line indicates chosen division between basal layers (including subgranular cell layer) and the outer layers (OL) of the DG. Arrows point to BrdUrd-positive cells in the basal layers, where most of the newly born cells can be found at this survival point. The number of pyknotic cells per mm2 (D) is clearly higher in the basal layers of the DG than in the outer layers (ol). (E) TUNEL was used to assess cell death in the DG of ethanol vs. control-fed rats. (Bar = 25 μm.) Positive labeling was observed predominantly in the basal layers (6-week survival). (F) There was a marked increase in the number of TUNEL-positive cells per section in ethanol-fed rats (6.5 ± 0.87, n = 4) as compared with controls (2.5 ± 0.87, n = 4). P ≤ 0.01, Mann–Whitney test (6-week survival). (G) BrdUrd-labeled pyknotic cells in the DG. BrdUrd was administered 3 days before perfusion (BrdUrd in red, nuclear staining in green with Cyquant 1:2,000; BrdUrd protocol 2). (Bar = 10 μm.) (H) Apoptotic nuclei were observed in the basal layers of the DG of ethanol-fed rats at the ultrastructural level (6-week survival). The arrow points to the typical fragmentation of the nuclear membranes in advanced stages of apoptosis. Also note dense chromatin within the periphery of the nucleus. (Bar = 5 μm.)

