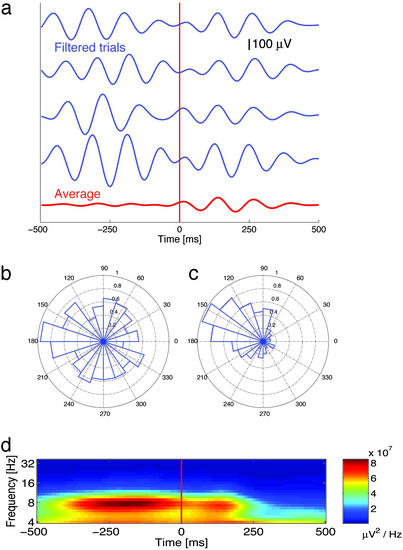
Fig. 2.
Probes reset 8-Hz phase. (a) Filtered (6–10 Hz) single trials (blue lines) and average activity (red line) illustrating phase reset to the probes at the level of single trials for the 1-s interval surrounding probe onset (occuring at time t = 0). (b) An 8-Hz phase distribution 250 ms before the onset of the probe (calculated across 320 trials) is shown. (c) An 8-Hz phase distribution 250 ms after probe onset is shown. (d) Spectrogram showing average power (calculated across all trials, without filtering) at each frequency for the 1-s interval surrounding probe onset. For all panels, the electrode is the same as in Fig. 1b.

