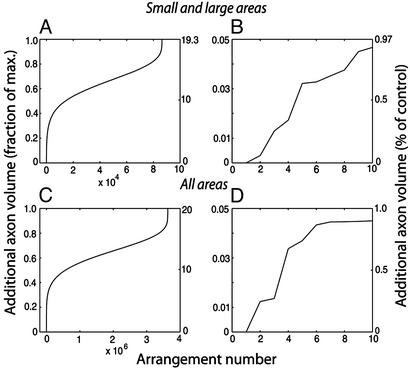
Fig. 3.
Additional axonal volume in alternative cortical configurations. Additional interareal axonal volume (compared with the axonal volume for the actual cortex) for all possible arrangements was ranked in ascending order and plotted versus its rank. Scales on the left are normalized and scales on the right give the percent change from actual cortex. (A) Six small and five large areas were permuted within each group and all possible combinations were considered for a total of 6!·5! = 86,400 alternative configurations. (B) Ten best configurations from A. The best configuration has 0 additional axonal volume and corresponds to the actual arrangement of areas. The second-best and third-best alternatives correspond to the exchange of areas 10m ↔ 32 and 10o ↔ 11m, respectively. In the worst alternative, all areas were misplaced from their positions. (C and D) Same as A and B, respectively, for all selected areas except for 10m. All possible permutations of 10 areas give 10! = 3.629 million alternative configurations. As in A, C shows the best configuration has 0 additional axonal volume and corresponds to the areal configuration of the actual cortex. Because area 10m is not moved in this calculation, the second-best alternative corresponds to the third best of A and B: exchange of areas 10o ↔ 11m. Third-best and fourth-best alternatives correspond to exchange of areas 11m ↔ 14r and 12m ↔ 13l, respectively. As in A, C shows that in the worst alternative configuration all areas were misplaced from their positions.

