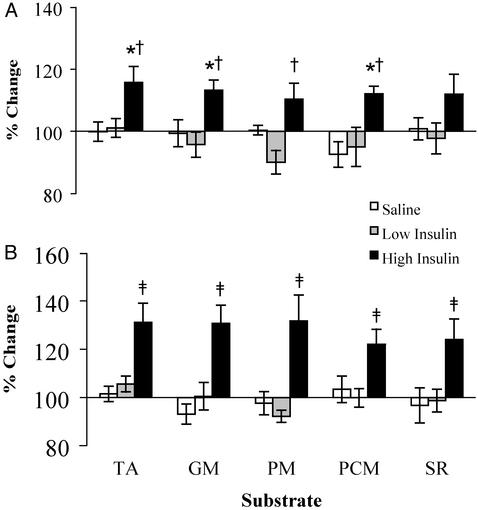
Fig. 3.
Vastus lateralis muscle mitochondrial ATP production rates after 4 h (A) and 8 h (B) of saline, low-dose insulin, and high-dose insulin infusion. Values are expressed as a percentage of preinfusion baseline (mean ± SEM). Measurements were made in the presence of five different substrate combinations, TA, GM, PM, PCM, or SR. *, Significantly different (P < 0.05) from the saline values; †, significantly different from the low insulin values at 4 h; ‡, significant difference from the saline values and low insulin values at 8 h (P < 0.01).

