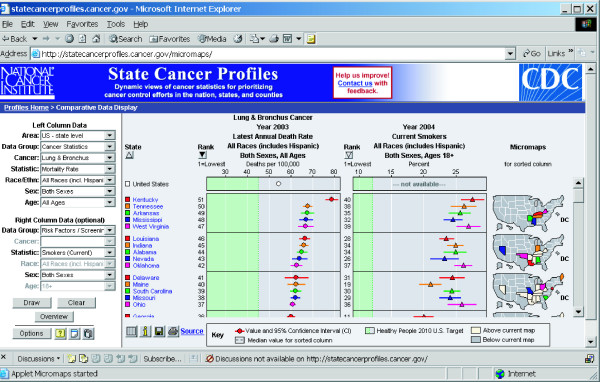
Figure 2.
Linked micromap (LM) plot. Linked micromap plots [17] combine statistical graphs and maps into a single interactive graphic. The user chooses the statistics to display in the columns. The maps color the areas in order of the sorted column (indicated by the darkened triangle) in groups of five.

