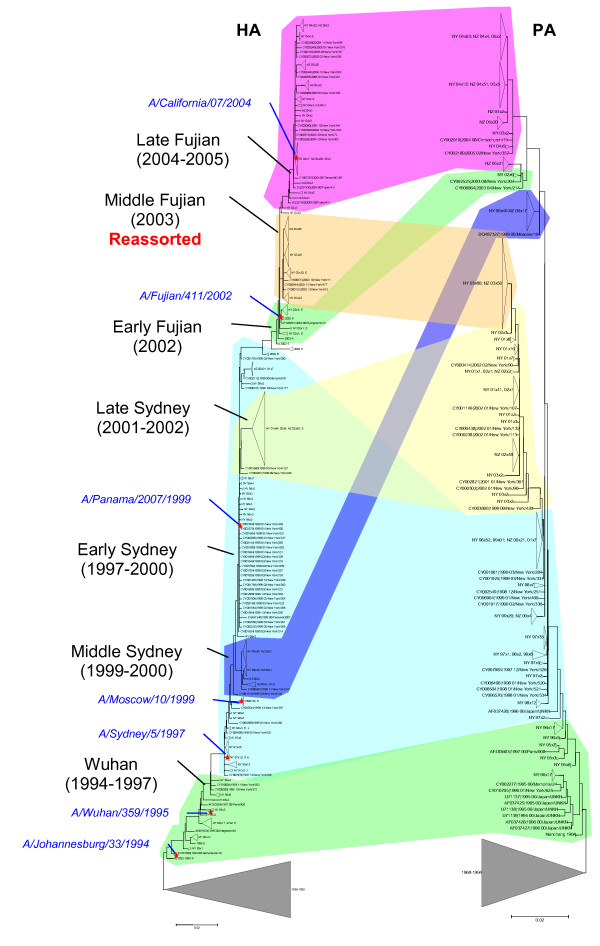
Figure 1.
A comparison of the phylogenetic trees for the HA and PA genes of the H3N2 subtype of influenza A virus from 1994–2005. The colored connectors indicate major discrepancies between the gene trees that result from reassortment. The subtrees corresponding to sequences from isolates prior to 1994 are collapsed to focus on isolates from 1994 through 2005 and portions of the trees are labeled ("Wuhan", "Middle Sydney", etc.) with names derived from antigenically distinctive isolates that dominated during particular time intervals. Approximate positions of the vaccine isolates are indicated by red asterisks and blue, italicized labels.

