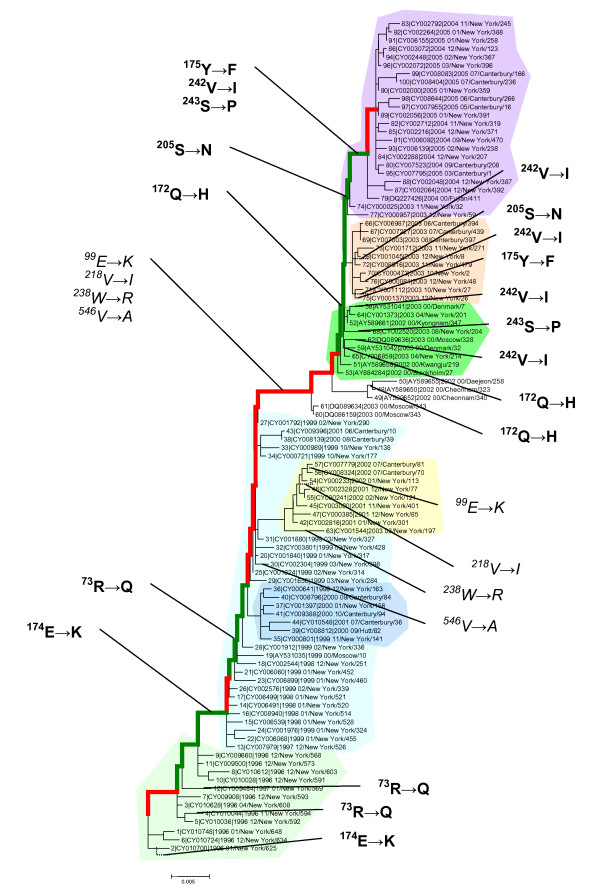
Figure 4.
Parallel amino acid replacements in H3N2 HA. The replacements in epitope regions are shown in boldface. Color-code for shading of lineages is as in Figure 1. Stasis intervals are indicated in red in the main trunk of the tree, while intervals associated with rapid fitness change appear in green, as in Figure 2.

