
FIGURE 4.
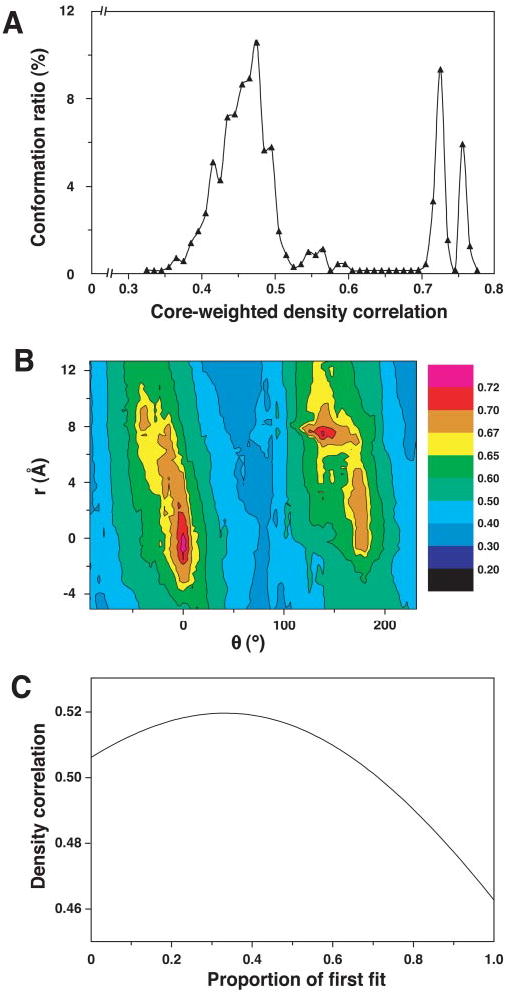
A, core-weighted density distribution of the 729 local maximums obtained from fitting the homodimeric E3·PSBD complex to the density of the E2E3 map using an automated Monte Carlo search performed as described under “Experimental Procedures.” B, contour plot of the core-weighted correlation function describing the locations of the two best fits of the homodimeric E3·PSBD complex, which are represented by the peaks with correlation values above 0.7. The spatial translation in x, y, z (r) and angular rotation (φ) from the best fit (global minimum) to the second best fit is indicated. C, plot describing the variation in correlation coefficients with change in relative proportion of the occupancies of the two best fit orientations. The fractional occupancy of the best fit was varied from 0 to 1 in increments of 0.01.