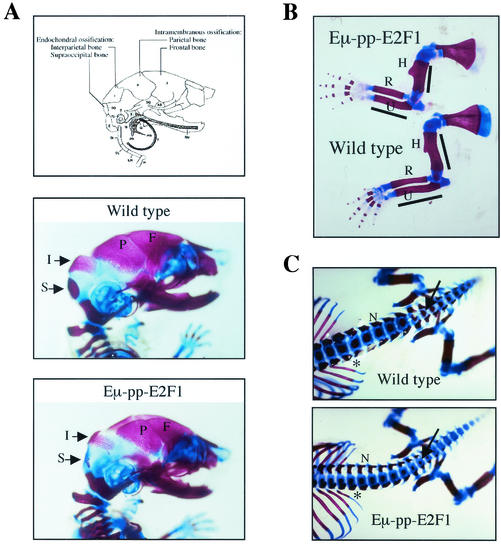
FIG. 4.
Skeletal analysis on E17.5 Eμ-pp-E2F1 transgenic mice. (A) Schematic representation of skull indicates distinct forms of ossification in interparietal (I) and supraoccipital (S) bones versus parietal (P) and frontal (F) bones. Lateral views of wild-type and Eμ-pp-E2F1 skulls stained with Alizarin red (calcified tissues) and Alcian blue (cartilage) are shown. (B) Lateral view of Eμ-pp-E2F1 and wild-type forelimbs. The humerus (H), radius (R), and ulna (U) are indicated. (C) Dorsoventral view of lumbosacral and tail vertebra showing reduced width of neural arches (N) as well as diminished degrees of ossification in distal vertebral bodies (arrow) and rib shaft regions (asterisk) of E2F1 transgenic mice compared to that of wild-type control mice.

