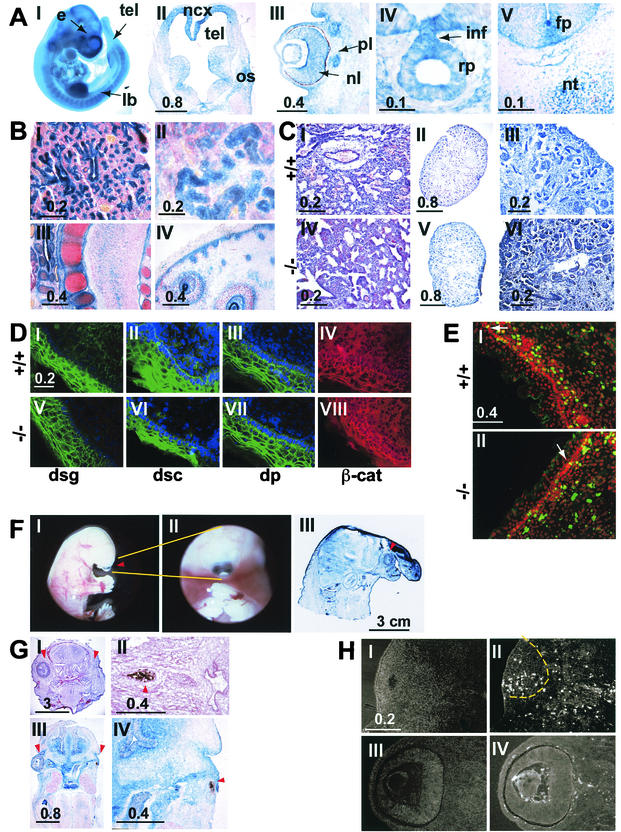
FIG. 2.
(A) The lacZ reporter gene was used to analyze the pattern of expression of the FAT1 gene in the embryo. Micrographs I to V show X-Gal staining in an intact (I) or sectioned (II to V) E12.5 embryo. The staining is strong in the forebrain (tel in panel I), mainly in the neocortex around the telencephalic vesicles (top part of panel II; note the lower level of staining in the ganglionic eminences in the lower part of the section), in the limb buds (panel I), in the developing eye (panel III), and in Rathke's pouch (panel IV). Panel V shows lacZ expression in the spinal cord of an E12.5 embryo. Note the staining in the region of the floor plate. e, eye; fp, floor plate; inf, infundibulum; lb, limb bud; ncx, neocortex; nl, neural layer; nc, notochord; os, optic stalk; pl, pigment layer; rp, Rathcke's pouch; tel, telencephalon. Bars indicates sizes in millimeters. (B) lacZ staining in newborn mFAT1−/− pups. Epithelial cells in the lungs (I) and kidneys (II), cells surrounding developing cartilage (III), and the basal layer of the epidermis in the skin (IV) show a strong X-Gal staining. All sections were counter stained with Neutral Red. Bars indicate sizes in millimeters. (C) Hematoxylin-eosin staining of sections from lungs of wild-type and mFAT1−/− mice (panels I and IV) and kidneys (panels II and V; shown at higher power in panels III and VI, respectively). Light microscopy does not reveal any differences between the different genotypes. Bars indicate sizes in millimeters. (D) Distribution of adhesion-related proteins in skin from wild-type and mFAT−/− mice. No differences between the mutant and the wild-type animals were observed when using antibodies against the desmosomal proteins desmoglein (dsg), desmocollin (dsc), and desmoplakin (dp). The cellular distribution of β-catenin also does not shown any alteration between the wild-type and mFAT1−/− mice. (E) Anti-BrdU immunofluorescent labeling (green) and propidium iodide (red, to visualize nuclei) in the skin of wild-type and mutant mice after BrdU incorporation in vivo, as described in Materials and Methods. Labeled cells in the basal layer of the epidermis are indicated by white arrows, and no differences were observed in the labeling index in this cell layer. Note the lack of labeling in the more superficial epidermal cells. The labeled cells in the underlying dermis were not included in the analysis. (F) The holoprosencephaly phenotype seen in some mFAT1−/− mice is illustratedin micrographs I and II, which show lateral and ventral views of an intact embryo with cyclopia (an eye in the centre of the face [arrowhead in panel I]). Micrograph III shows a cross-section of a newborn mutant mouse with holoprosencephaly, showing a proboscis protruding above the eye (arrowhead). The section has been stained with X-Gal, showing the expression of lacZ from the transgene. (G) The eye phenotype observed in many of the FAT1−/− mice is shown. Micrographs I to IV are tissue sections from two different homozygous null embryos, one at E17.5 stained with hematoxylin and eosin (panels I and II) and one at E13.5 stained with X-Gal (panels III and IV). Note the complete loss of one eye in panels I and III (right arrowhead, with normal eye indicated by left arrowhead) and the presence of retinal pigment epithelium but not neural retina and lens in II and IV (arrowhead). Bars indicate sizes in millimeters. (H) TUNEL staining of an E13.5 embryo with an abnormal eye. The number of TUNEL-positive cells is dramatically increased in the abnormal eye (panels I and II, with panel I showing a 4′,6-diamidino-2-phenylindole (DAPI)-labeled section to visualize tissue and panel II showing TUNEL-positive cells, with the eye indicated by the dashed line) compared with the normal eye (panel III and IV). Bars indicate size in millimeters.

