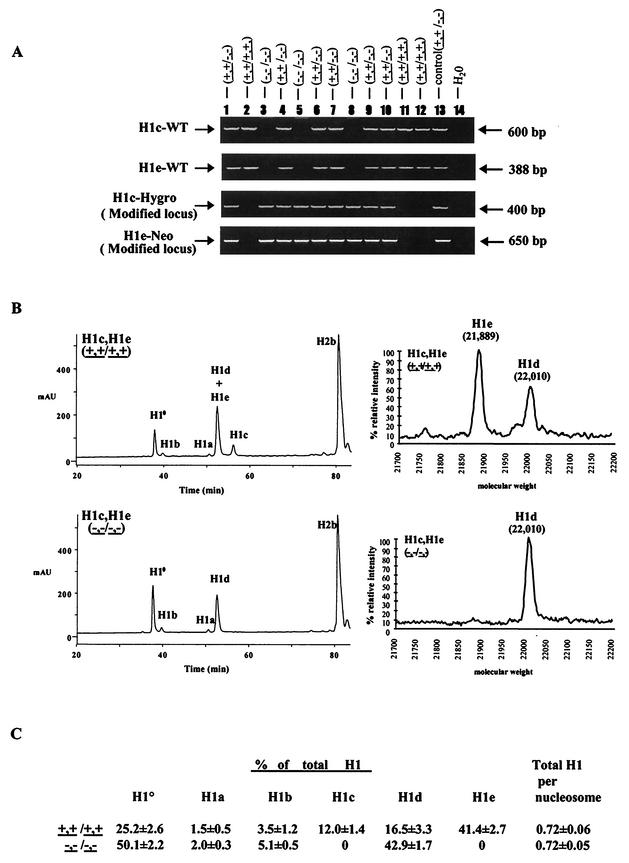
FIG.2.
Analysis of H1c H1e double-knockout (KO) mice. (A) Genotype analysis of F2 mice from intercrosses of H1cH1e++/−− mice. Mouse tail DNA was analyzed by PCR (as described in Materials and Methods) for the wild-type H1c allele (H1c-WT), the wild-type H1e allele (H1e-WT), the modified H1c allele (H1c-Hygro), and the modified H1e allele (H1e-Neo). The deduced genotype of each embryo is indicated above each lane. The positions of the PCR products from the wild-type and modified alleles are indicated. Control reaction mixtures contained tail DNA from an H1c H1e double-heterozygous mutant mouse. (B) Analysis of histones extracted from livers of wild-type and H1c H1e double-homozygous mutant mice. The graphs on the left show results of reverse-phase HPLC analyses of approximately 100 μg of total liver histone extracts from a 20-week-old wild-type mouse (top) and an H1c H1e double-homozygous mutant (bottom). The abscissa represents elution time, and the ordinate represents absorbency at 214 Å. The identity of the histone subtype(s) in each peak is indicated. mAU, milli-absorbency units. The graphs on the right show results of time-of-flight mass spectrometry analysis of a fraction eluting between 52 and 54 min (corresponding to the peak marked H1d + H1e). The identities of the H1d and H1e subtypes detected in this analysis were shown previously (51). (C) H1 subtype composition of liver chromatin from wild-type and H1c H1e double-mutant mice. Data were calculated from HPLC analyses of wild-type and H1c H1e double-mutant strains like that shown in panel B. Values are means ± standard deviations of individual determinations made on three 5-month-old mice of each of the indicated genotypes. The percentage of total H1 was determined by the ratio of the A214 of the indicated H1 peak to the total A214 of all of the H1 peaks. Total H1 per nucleosome was determined by the ratio of the total A214 of all of the H1 peaks to half of the A214 of the H2b peak. The A214 values of the individual H1 peaks and the H2b peak were adjusted to account for the differences in the number of peptide bonds in each H1 subtype and H2b.

