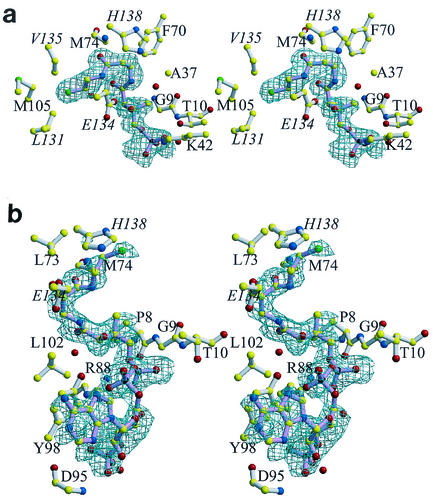
FIG. 3.
Stereo views of the binding of CoA to PPAT. For clarity, water molecules (red spheres) are not labeled, and only the groups that participate in binding (i.e., main chain or the side chain atoms) are shown. The protein structures shown in panels a and b are in similar orientations. Labels for residues belonging to a threefold-related subunit are italicized. Final σA (28) weighted difference omit electron density map for CoA bound to subunit B (a), where electron density is visible only for the Ppant moiety of CoA, and the twofold-related protomer A (b). The contour level of the electron density maps is 2.5σ, and the resolution is 1.78 Å. The bonds of CoA (pink) and the bonds of the enzyme (white) are shown. Color coding of atoms is explained in the legend to Fig. 2. This figure was produced with MolScript (19) or BobScript (11) and Raster3D (22) programs.

