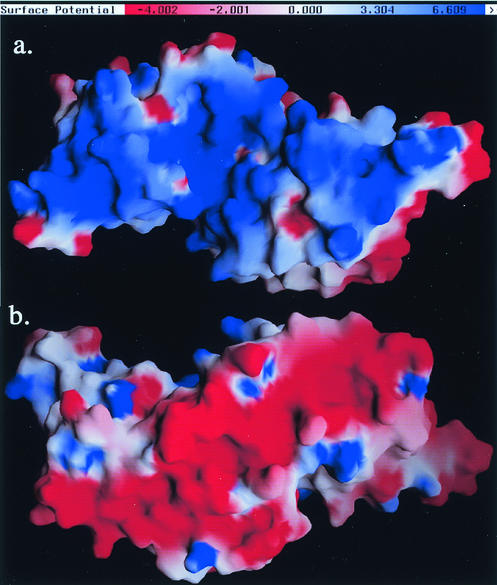
FIG. 4.
The electrostatic potential surface of SarS calculated by GRASP (29), with charges of +1 for Lys and Arg, −1 for Glu and Asp, and zero for all other residues. The color bar from red to blue represents the potential from negative to positive, defined as in GRASP. (a) The putative DNA-binding surface; (b) the possible activation motifs.

