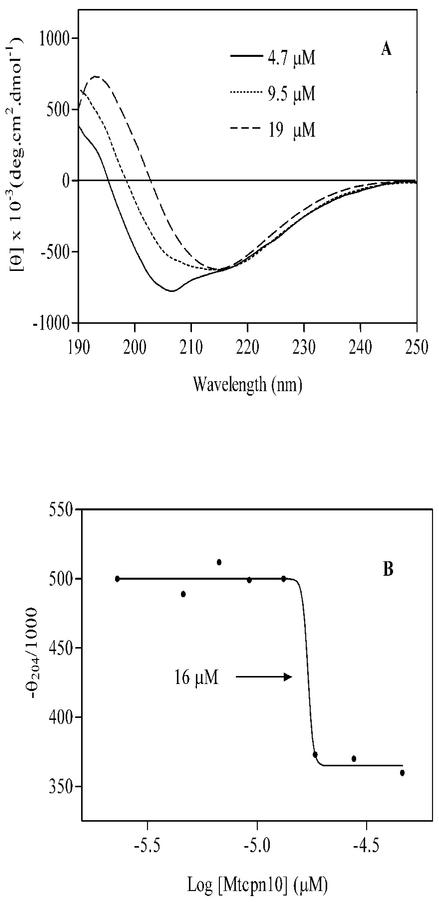
FIG. 4.
Protein concentration dependence of the CD structure of M. tuberculosis Cpn10 in water/MeOH (1:1, vol/vol) solutions. (A) CD spectra of M. tuberculosis Cpn10 at three different concentrations. (B) Concentration dependence of the molar ellipticity at 204 nm observed in 100 mM KH2PO4-MeOH (1:1, vol/vol) in the concentration range from about 2.4 to 47 μM. The midpoint of the structural transition, at 16 μm, is shown.

