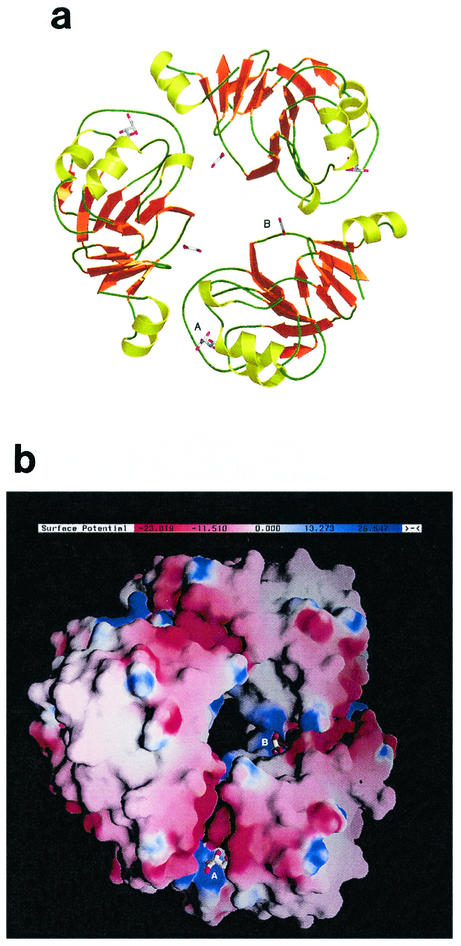
FIG. 3.
Rv3853 trimer, shown (a) as a ribbon diagram, drawn with Pymol (8), and (b) in a surface representation, drawn with GRASP (27), showing the distribution of surface charge. In both diagrams, the putative tartrate (A) and glyoxalate (B) molecules are shown in stick representation, bound to each of the three monomers. Adjacent to the tartrate binding site is a prominent, negatively charged canyon at the subunit interface that contains several residues conserved in all Rv3853 homologs.

