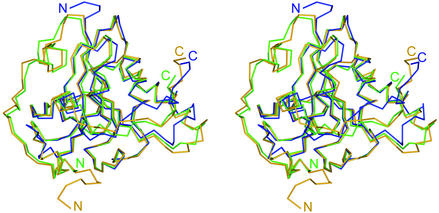
FIG. 4.
Stereoview of alignment of the Cα backbones of the MsrAMtb, MsrABt, and MsrAEcoli crystal structures shown in blue, green, and orange, respectively. N and C termini are designated according to the same color code. MsrAMtb Cα atoms align to those of MsrABt with an RMSD of 1.5 Å for 161 target pairs and to MsrAEcoli with an RMSD of 1.6 Å for 161 target pairs. The C terminus of MsrAMtb exhibits the largest structural variation when compared to MsrABt and MsrAEcoli (see text). This figure was generated using BOBSCRIPT (14), GLR (version 0.5.0; National Institutes of Health; http://convent.nci.nih.gov/∼web/glr/glrhome.html), and POV-Ray (version 3.5; POV-Team; http://www.povray.org).

