FIG. 2.
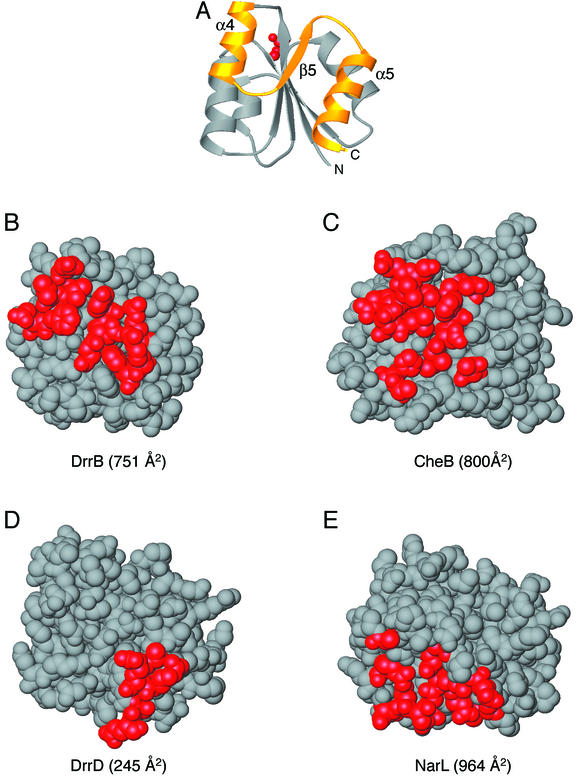
Regulatory domain surfaces involved in interdomain interfaces. (A) Ribbon diagram of a representative regulatory domain indicating the orientation of the regulatory domains depicted in panels B to E. Red, active-site Asp; gold, α4-β5-α5 face of the regulatory domain that undergoes conformational changes in response to phosphorylation. (B to E) Space-filling models of the regulatory domains of DrrB (B), CheB (PDB accession code 1A2O [11]) (C), DrrD (1KGS [8]) (D), and NarL (1A04 [2]) (E). Red, residues involved in interdomain associations in each protein. In DrrB, this interface extends across the entire α4-β5-α5 face of the regulatory domain and is 751 Å2. The CheB interdomain interface is ∼800 Å2 and also spans the majority of this surface. The DrrD interface is much smaller, 245 Å2, and is localized to the C-terminal region of helix α5. The NarL interdomain interface, 964 Å2, utilizes some residues in the α4-β5-α5 region of the domain but also includes residues from the α3 helix and surrounding loops.

