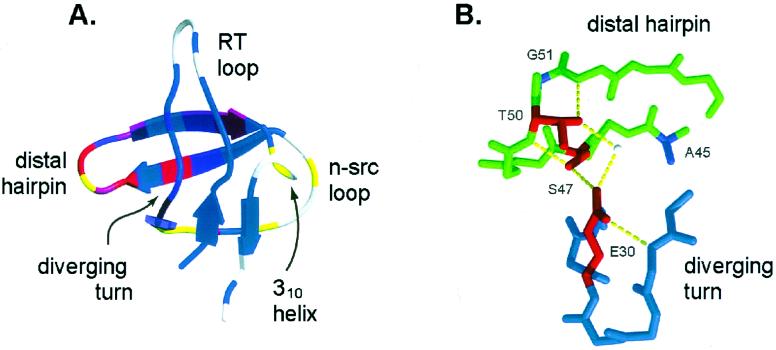
Figure 1.
(A) Structure of the src SH3 domain (1fmk.pdb) colored by previously reported ΦF-values (13) on a continuous scale from red (ΦF = 1) to blue (ΦF = 0). Residues at which mutations increase or decrease both kf and ku are colored in yellow. The graphic was generated with molscript (33) and raster3d (34, 35). (B) Structure of the hydrogen bond network between the β-distal hairpin and the diverging turn (midas; refs. 36 and 37). Residues included in the double-mutant cycles are shown in red.

