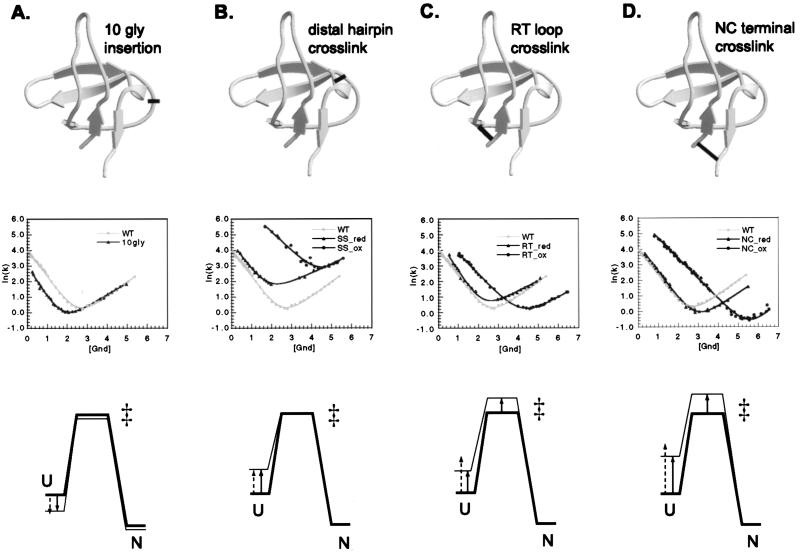
Figure 3.
Characterization of the 10-glycine insertion (A), the distal hairpin crosslink (B), the RT loop crosslink (C), and the N- and C-terminal crosslink mutants (D). For each modification, panels from Top to Bottom show site of the modification, kinetic analysis, and an energy diagram explaining the effects on kinetics. The structure diagrams of the SH3 domain were generated with molscript (33) and raster3d (34, 35). Energy diagrams show the relative free energies of the unfolded (U), the transition (‡), and the native state (N) before (thick lines) and after (thin lines) each modification. In the case of the 10-glycine insertion, the reference protein is the WT, and, for the three disulfide crosslinks, the reference is the reduced version of the particular double cysteine mutant. Solid arrows indicate the experimentally determined changes in the free energy of denatured state, and dashed arrows indicate the changes predicted from loop entropy estimates (16). 10gly, 10-glycine; NC, N- and C-terminal crosslink; SS, distal hairpin crosslink; red, reduced; ox, oxidized.

