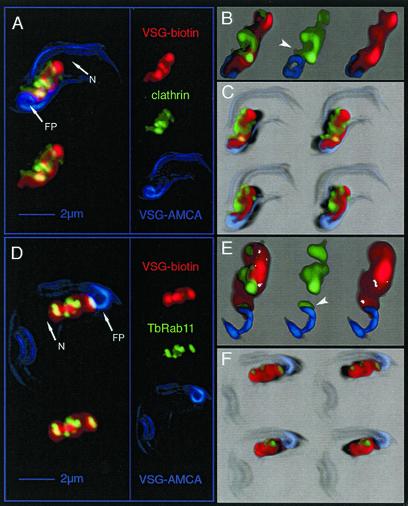
Figure 2.
Analysis of the distribution of clathrin, TbRAB11, and endocytosed VSG in T. brucei by 3D image processing. The different fluorescence channels of deconvolved 3D images reduced in size to 66% are designated on the right in A and D: red, endocytosed biotin-labeled VSG; green, clathrin or TbRAB11; and blue, AMCA-labeled VSG located at cell surface. Three different visualization methods were applied to illustrate the 3D image information. (A and D) Maximum intensity projection (MIP) is a volume rendering technique that determines at each pixel the highest data value encountered along the corresponding viewing ray. The overall VSG distribution within the area between the FP and the nucleus (N) has a structured appearance with sharp borders. Both clathrin (A) and TbRAB11 (D) localize to distinct parts within this region. The upper left images represent the projection of all three fluorescence channels, whereas in the lower left images AMCA fluorescence has been omitted. 3D-animations of the MIP images shown herein, which allow a better navigation, can be found in the supplementary material to this article. (B and E) In addition to MIP, a volume-rendering technique uses the transparency information of the 3D data set to blend all values along the viewing direction (transparency blending). This offers the possibility to display also weak or fuzzy structures. Transparency blending reveals that clathrin and TbRAB11 are in fact localized to distinct subcompartments of the endocytic system. In addition, a significant amount of the clathrin signal can be visualized outside of the VSG-containing structure. The juxtaposition of clathrin or TbRAB11 with respect to VSG at the flagellar pocket membrane is indicated by arrow heads. (C and F) Shadow projection is a ray-tracing technique that uses artificial light to illuminate structures. A viewing ray is sent through the volume image and, using the principle of the simulated fluorescence process, it is evaluated, which voxel is visible to what degree. This allows documentation of the spatial distribution of clathrin (C) and TbRAB11 (F) with respect to endocytosed VSG. Light directions and points of view were altered to allow visualization of cells from different sides (top, view from above; bottom, view from below). A significant amount of clathrin locates to the periphery of VSG-containing endosomes (C), whereas TbRAB11-positive structures seem embedded within the endocytic compartment (F).

