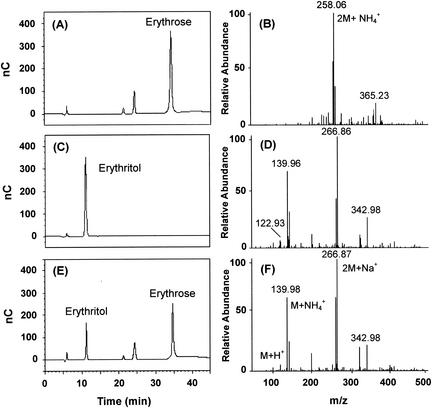
FIG. 2.
HPLC (BioLC; Dionex, Sunnyvale, Calif.) analysis of the reaction products of C. magnoliae ER. Erythrose (5 mM) was incubated with C. magnoliae ER (1 U) at 37°C for 2 h. The enzyme was incubated in a mixture of buffer and erythrose with 1.0 mM NADPH. The sample was eluted isocratically on a CarboPac MA1 column with 500 mM NaOH at a flow rate of 0.4 ml/min and detected with a BioLC ED50A electrochemical detector. Panels A and B show the respective HPLC profile and mass spectrum of authentic erythrose while panels C and D show those of authentic erythritol. Panel E shows the HPLC profile of the reaction products. The reaction mixture was diluted, filtered through a 0.2-μm-pore-size membrane, and subjected to HPLC analysis. The results for the residual substrate erythrose (34.6 min), the product erythritol (11.2 min), and the contaminants (22.4 and 24.5 min) are illustrated. The peaks were assigned based on the retention times of the standard samples. Panel F shows the mass spectrum of erythritol enzymatically formed by the C. magnoliae ER.

