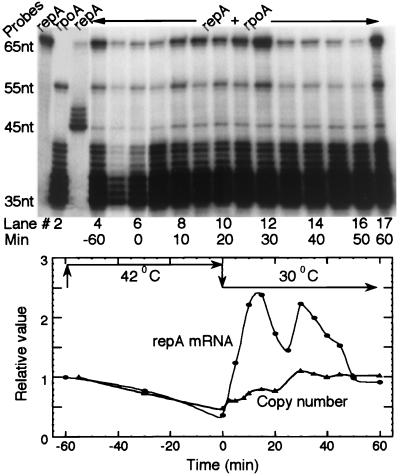
Figure 2.
Replication-induced transcription of repA assayed by S1 nuclease protection. Replication initiation in PC2 (dnaCts) cells was synchronized by incubation at 42°C for 60 min followed by return to 30°C at zero min (arrows, Lower). Total cellular RNA was isolated at different time points, hybridized with repA and rpoA (a normalizing control) mRNA-specific probes, and analyzed by S1 protection. Lane 1: RNA of PC2 without any plasmid assayed with repA probe only, showing no hybridization of the probe to host messages. Lanes 2 and 3: RNA from PC2/pALA162 (the plasmid is an overproducer of RepA; ref. 29) assayed with rpoA (lane 2) and repA (lane 3) probes separately to mark positions of repA and rpoA signals. The 65- and 55-nt bands represent the unhybridized (full length) repA and rpoA probes, respectively, that escaped S1 digestion. The 45- and 35-nt bands represent probes that were protected from S1 digestion because of specific hybridization to repA and rpoA messages, respectively. The ladder of bands above 45- and 35-nt bands represents incomplete digestion products of the hybridized probes as explained in Materials and Methods. Lanes 4–17: RNA from PC2/pSP102 assayed at indicated times with both the probes. The normalized levels of repA message from these lanes are presented graphically (Lower, ●). The relative copy number of pSP102 at indicated times is also determined (▴).

