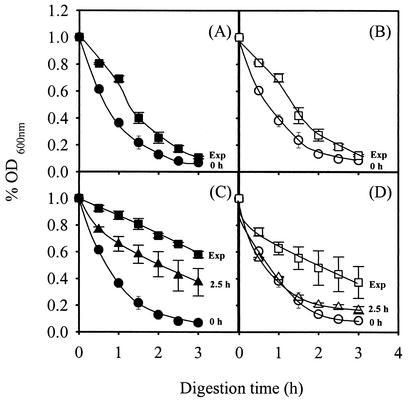
FIG. 6.
Lyticase sensitivities of cells of wild type (A and C) and Δspi1 (B and D) strains that were grown in the absence of 2,4-D and then incubated in growth medium unsupplemented (A and B) or supplemented with 0.3 mM 2,4-D (C and D) and harvested during the growth represented by the growth curves shown in Fig. 3, specifically, at time zero, after 2.5 h of incubation, and at the exponential phase when culture OD600 reached 1 (Exp). The different cell populations were washed with water and resuspended in 0.1 M sodium phosphate buffer, pH 7.5. After addition of 10 μg of lyticase (Sigma) per ml, the decrease in the OD600 of the cell suspension was measured periodically. Data are the means ± standard deviations of at least three independent experiments.

