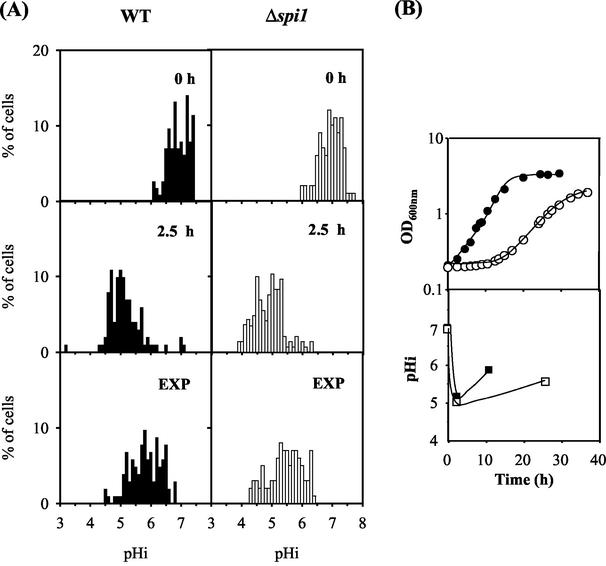
FIG. 8.
(A) Distribution of cells of S. cerevisiae BY4741 (WT) and Δspi1 deletion strains with different pHi values during cultivation under 2,4-D stress. WT, wild type. (B) Average pHi values for wild-type (▪) and Δspi1 (□) 2,4-D-stressed cell populations. Cells were cultivated in the presence of 0.3 mM 2,4-D and harvested at time zero (0 h), after 2.5 h, and at the exponential phase (OD600 = 1 ± 0.1; EXP). Representative growth curves (B, top) for wild-type (•) and Δspi1 (○) strains are shown. Cells were labeled with 5 (6)-CFDA,SE, and pHi was measured by fluorescence imaging. In vivo calibration curves were used to convert measurements of fluorescence to pHi values.

