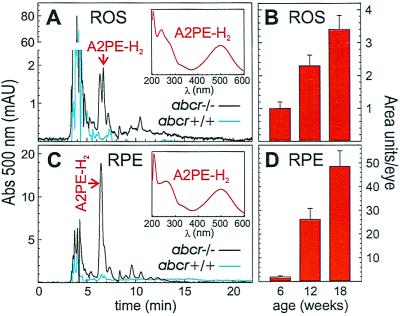
Figure 1.
HPLC analysis showing A2PE-H2 in rod outer segment (ROS) and RPE. (A) Chromatogram of phospholipid extracts from 12-week-old abcr+/+ (light blue tracing) and abcr−/− (black tracing) ROS. Detection wavelength is 500 nm. Inset shows absorption spectrum of A2PE-H2 peak fraction, indicated by red arrow. (B) Histogram showing levels of A2PE-H2 in ROS from abcr−/− mice at the indicated ages in area units per eye. Error bars show standard deviations. (C) Chromatogram of phospholipid extracts from 12-week-old abcr+/+ (light blue tracing) and abcr−/− (black tracing) RPE. Detection wavelength is 500 nm. Inset shows absorption spectrum of the A2PE-H2 peak fraction, indicated by red arrow. (D) Histogram showing the relative levels of A2PE-H2 in RPE from abcr−/− mice at the indicated ages in area units per eye, ± standard deviations. Note that A2PE-H2 is exclusively present in ROS and RPE from abcr−/− mice.

