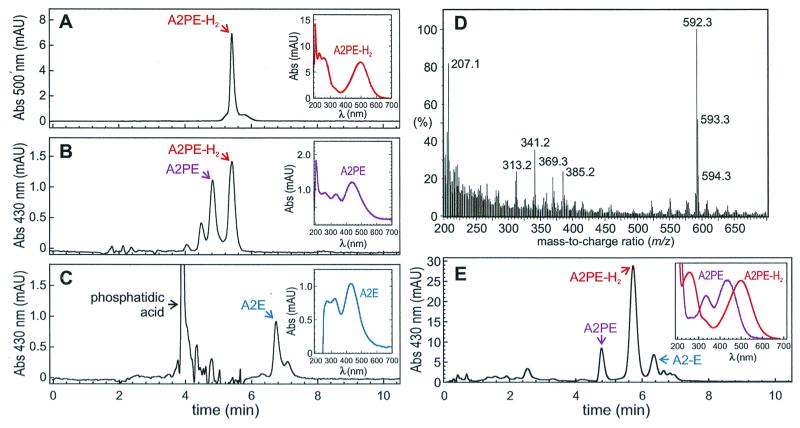
Figure 2.
HPLC analysis showing the A2PE intermediate in the formation of A2E. (A) Chromatogram of A2PE-H2 purified from 11-month abcr−/− outer segments. Detection wavelength is 500 nm. Inset shows spectrum of the A2PE-H2 peak, labeled with the red arrow. (B) Chromatogram of A2PE-H2 fraction from A after 5 min incubation in HCl. Detection wavelength is 430 nm. The A2PE-H2 peak is labeled with the red arrow. Inset shows spectrum of the A2PE peak, labeled with the purple arrow. (C) Chromatogram of A2PE-H2 fraction from A after overnight incubation in HCl. Detection wavelength is 430 nm. The phosphatidic acid peak is labeled with the black arrow. Inset shows spectrum for the A2E peak, labeled with the blue arrow. Note the disappearance of A2PE-H2 and A2PE and the appearance of phosphatidic acid and A2E. (D) Mass spectrum of A2E fraction from C. Note the major molecular-ion species with a m/z ratio of 592.3. The additional labeled peaks were also present in a sample containing only solvent. (E) Chromatogram of phospholipid extract from 6-month-old abcr−/− RPE. Detection wavelength is 430 nm. Inset shows spectra for the A2PE peak, labeled with the purple arrow, and A2PE-H2 peak, labeled with the red arrow.

