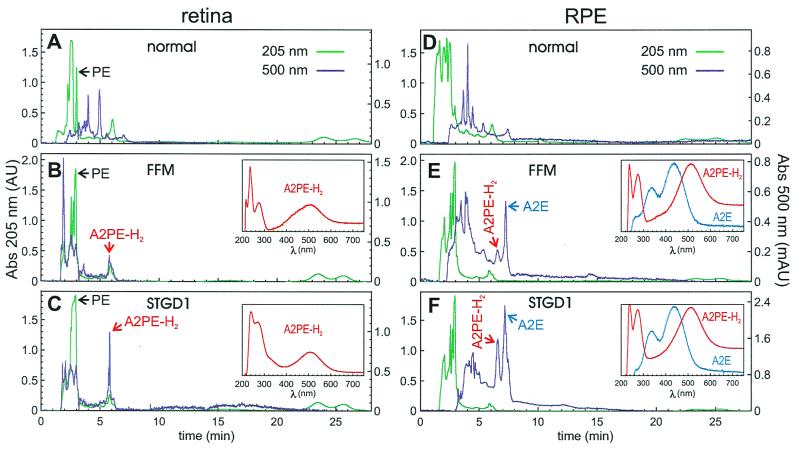
Figure 3.
HPLC analysis of phospholipid extracts from human retina and RPE showing phosphatidylethanolamine, A2PE-H2, and A2E accumulation. A and D show analysis of retina and RPE, respectively, from a 71-year-old female with no retinal pathology as a representative control. B and E show analysis of retina and RPE, respectively, from a 62-year-old female with FFM. C and F show analysis of retina and RPE, respectively, from a 73-year-old male with STGD1. Chromatograms are shown at detection wavelengths of 500 (dark purple tracing) and 205 nm (green tracing) to display retinoid-conjugate and phospholipid absorption, respectively. For A–F, the 205-nm scale (Left) is in absorption units (AU), and the 500-nm scale (Right) is in milliabsorption units (mAU). Peaks corresponding to phosphatidylethanolamine (PE) in the retina samples are labeled with the black arrows. Insets show absorption spectra for the labeled A2PE-H2 (red arrow) and A2E (blue arrow) peaks.

