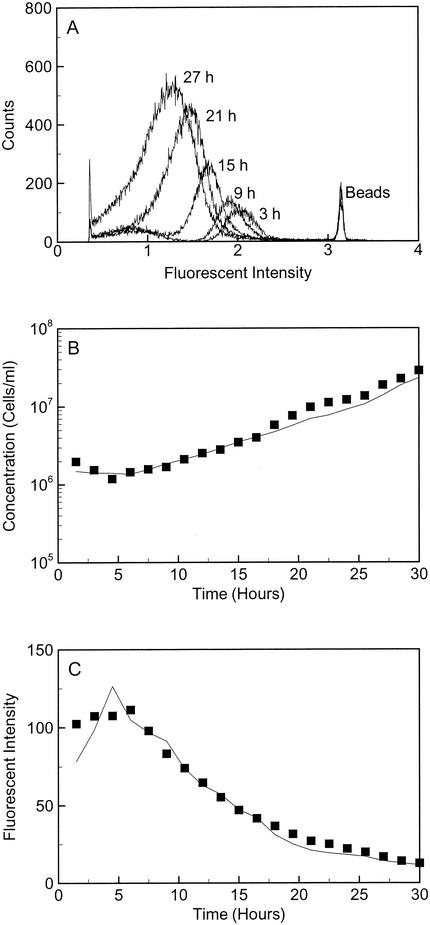
FIG. 2.
(A) Raw flow cytometry data for OY-107 in SOFA-GW with amendments and lactate for every fourth sample over the course of the microcosm growth experiment. The fluorescence intensity is plotted in log space. An increase in cell counts and a decrease in fluorescence intensity were observed for the cell population as growth occurred. (B) Observed (▪) and predicted (solid line) OY-107 cell concentrations in SOFA-GW with amendments and lactate over time. The cell concentration was calculated from the observed average fluorescence intensity values by the AFI method (equation 2). (C) Observed (▪) and predicted (solid line) stain intensities of OY-107 cells in SOFA-GW with amendments and lactate. The average fluorescence intensity was calculated from the observed cell concentration by the AFI method (equation 2).

