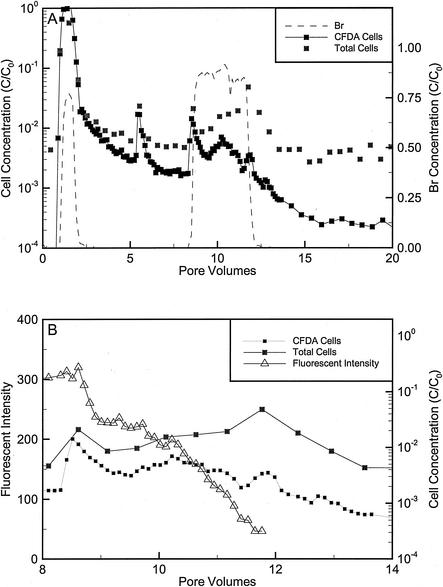
FIG. 4.
(A) Dimensionless Br and cell concentrations during the transport and biostimulation phases of the repacked core injected with DA001. Total counts were determined by counting cells stained with SYTO13 by flow cytometry. CFDA/SE concentrations were determined by counting stained cells with the flow cytometer. CFDA/SE concentrations may underestimate cell counts at late times because of stain loss. (B) Average fluorescence intensities, CFDA/SE cell counts, and total counts during the biostimulation phase of the core experiments. The initial concentrations (C0) of bacteria and Br were 2.3 × 10⁸ cells/ml and 1.57 mM, respectively. One pore volume corresponded to 6.6 h with an average velocity of 0.9 m/day.

