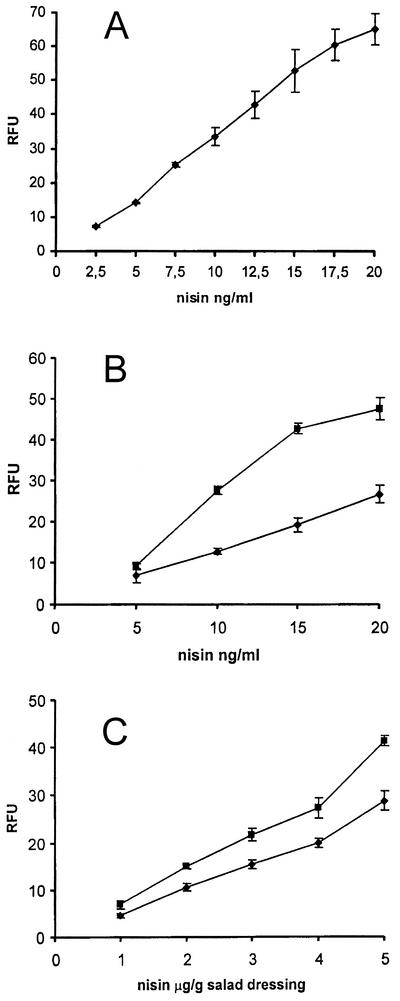
FIG. 4.
Standard curves for nisin concentrations in 0.1% Tween 80 (A) and in milk (▪) and cheese (♦) (B), expressed as final assay concentrations. The data are the means and standard deviations (error bars) of four parallel experiments. (C) Standard curves for Thousand Island (▪) and French (♦) salad dressings spiked with nisin, expressed as concentrations of nisin in the dressings. The data are the means andstandard deviations (error bars) of six parallel experiments. The background fluorescence values for samples not supplemented with nisin (26.2 ± 0.95 RFU for a pure solution, 56.9 ± 1.13 RFU for milk, 23.6 ± 0.76 RFU for cheese, 22.7 ± 0.61 RFU for Thousand Island dressing, and 21.6 ± 1.85 RFU for French dressing) were subtracted from the fluorescence values obtained with the samples spiked with nisin.

