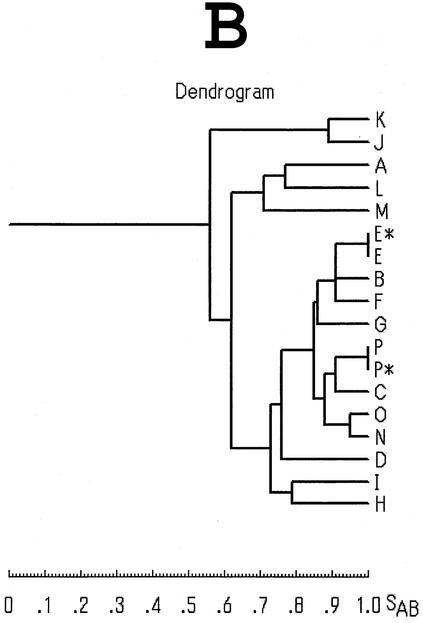
FIG. 4.
PFGE profiles of selected strains of V. parahaemolyticus and their relations. (A) PFGE profiles of NotI-digested genomic DNAs. The profiles were considered different if they differed by one or more DNA fragment. The profiles were classified into 15 profiles, arbitrarily designated A through P (indicated at the bottom). The asterisk denotes the profile obtained from reference strains. Lanes: M, molecular size markers (DNA size standard maker, lambda ladder; Bio-Rad); 1, FIHES98V1-32-4; 2, JKY-VP6; 3, VP-2; 4, BE98-2062; 5, VP1280; 6, KX-V225; 7, VP80; 8, VPF00-18; 9, VP1152; 10, APCC VP 9810; 11, 1001A44; 12, 1001A46; 13, APCC VP 00030; 14, APCC VP 00031; 15, 4917; 16, APCC VP 00157; 17, APCC VP 00190; 18, 5095. Test strains and their PFGE profiles are listed in Table 3. (B) Dendrogram constructed from the 15 PFGE profiles shown in panel A. The scale for the similarity coefficient is indicated as SAB.


