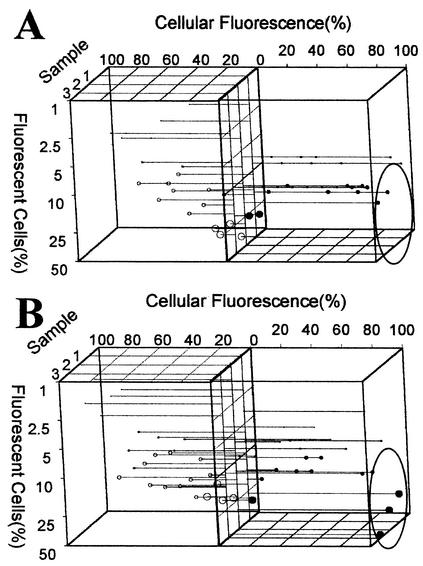
FIG. 4.
Influence of seasons on single-cell protein profiles. (A) Submerged aeration basin; (B) trickling filter. Samples were obtained weekly in the summer beginning in July 2002. The axes, data representation, and sample times are the same as those described in the legend to Fig. 3. Significant differences in the abundance of Fis-containing cells are indicated by ovals.

