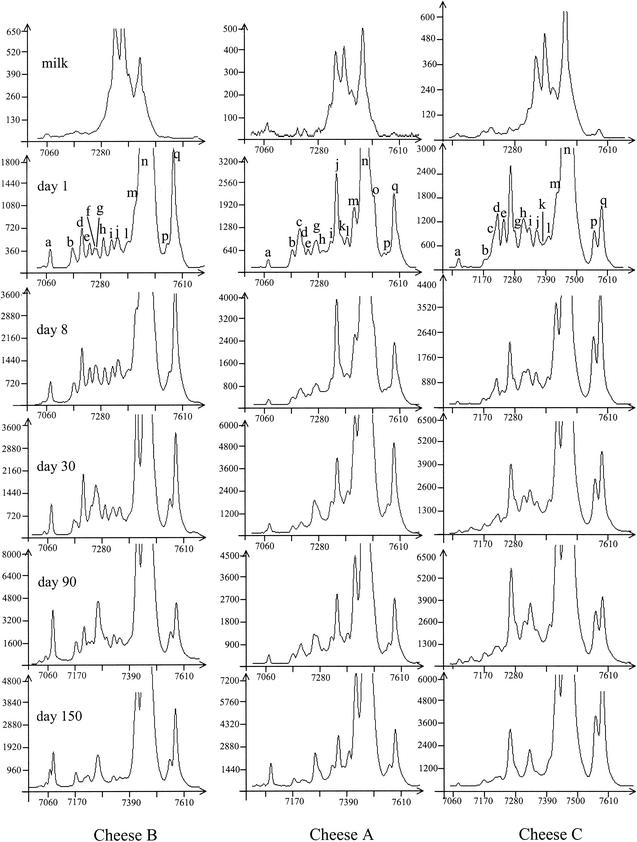
FIG. 3.
V3 SSCP patterns of PCR-amplified 16S rRNA gene fragments from bacterial communities of three milks and cheeses at different times of ripening. y axis, fluorescence; x axis, elution in scans (unit of GeneScan software). The positions and labeling of peaks discussed in Tables 2 and 3 and in the text are indicated.

