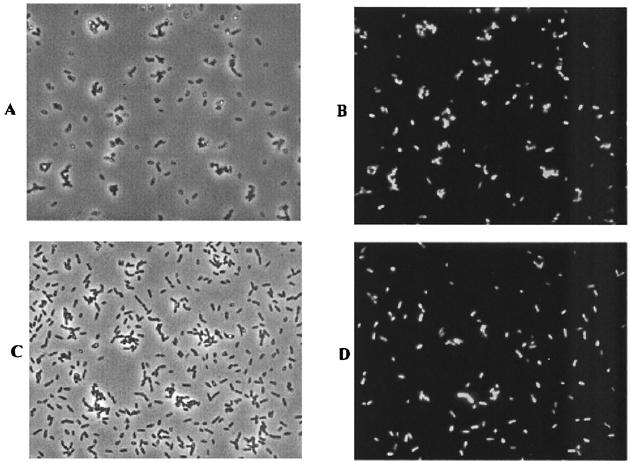
FIG. 2.
Microscopic analysis of GFP induction from exogenous sources of nitric oxide. (A) Phase contrast micrograph of 11.10/pMF3 cells 3 h after exposure to the NO generator sodium nitroprusside. (B) Fluorescence micrograph of the same field of cells shown in panel A. (C) Phase contrast micrograph of a mixture of 2.4.3 and 11.10/pMF3 cells. For this experiment, 2.4.3 cells were grown microaerobically in nitrate-amended medium and mixed with an equal volume of 11.10/pMF3 cells in a serum vial. The vial was sealed, supplemented with nitrate, and incubated for 2 h before the cells were photographed. (D) Fluorescence micrograph of the same field of cells shown in panel C.

