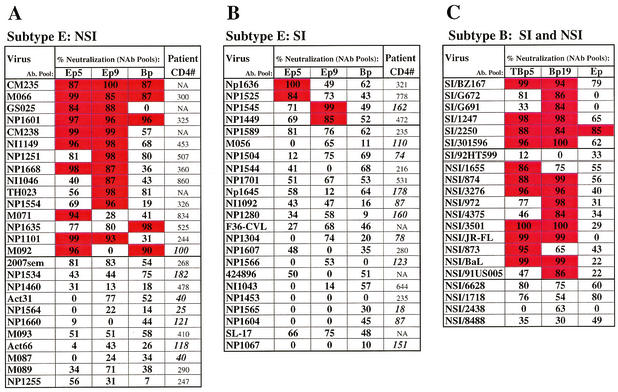
FIG. 1.
The percentages of neutralization for each of three NAb pools are indicated. For subtype E viruses, the B pool with the highest percent neutralization is listed in the Bp column; for subtype B viruses, the data for the most potent E pool are shown under the Ep columns. Values of ≥84% (within the upper [4th] quartile of the distribution of data for all E NAb-E virus neutralization pairs) are indicated by red squares, while <84% neutralization is indicated by white squares. Viruses that were strongly neutralized (≥84%) by at least one pool were considered sensitive. These data represent the mean of two to six experiments (in quadruplicate) for each virus; the patient CD4 cell numbers coincident with virus isolation are indicated for subtype E isolates. CD4 counts of <200 are in bold and italicized (panels A and B). NA, data not available.

