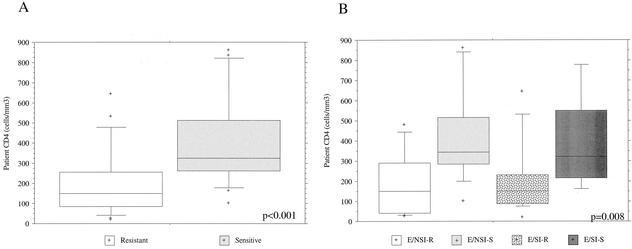
FIG. 3.
Differences in CD4 values of subtype E-infected patients with neutralization-sensitive and -resistant viruses. (A) All subtype E isolates were separated into two groups, based on neutralization sensitivity or resistance. The box plots show the distribution of concurrent patient CD4 values for each patient group, and the solid line represents the median. The boxed or shaded area displays the 25th to 75th percentiles, the top and bottom bars identify the 10th and 90th percentiles, and all plus signs represent CD4 counts falling outside the 10th and 90th percentiles. These data were analyzed by the Mann-Whitney U test (P < 0.001). (B) Box plots were prepared as described for panel A, except that CD4 counts for subtype E-infected patients having NAb-sensitive (S) or -resistant (R) isolates were further divided into four groups on the basis of SI or NSI viral phenotypes. There was a difference within the four groups as determined by a Kruskal-Wallis test (P = 0.008); the CD4 counts for patients with NSI-resistant viruses were significantly lower than those for patients with NSI-sensitive isolates (P = 0.013; Wilcoxon rank sums).

