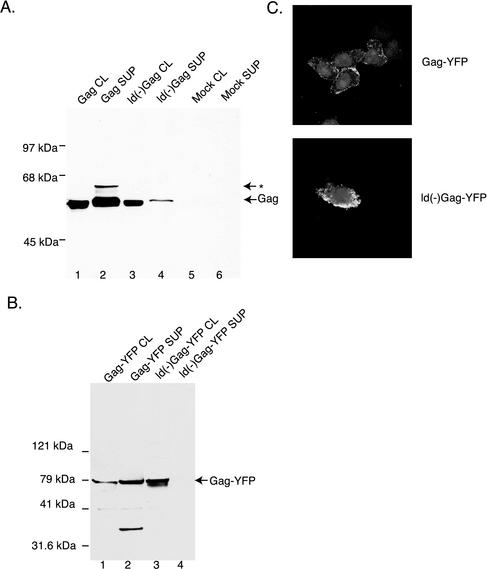
FIG. 1.
EIAV Gag VLP production and cellular localization. (A and B) Cell lysates and culture supernatants from transfected 293T cells were subjected to SDS-PAGE and Western blot analysis with anti-EIAV Gag (A) and anti-GFP (B) primary antibodies. Arrows denote Gag products. The asterisk denotes higher-molecular-mass species that frequently cross-react with antibody. Molecular masses are shown to the left of the blots, and lane numbers are shown below. (C) Confocal microscopy of Gag-YFP fusion-transfected HeLa cells. Both panels represent single optical sections. The membrane-localized fluorescence signal was similarly seen in unfixed cells.

