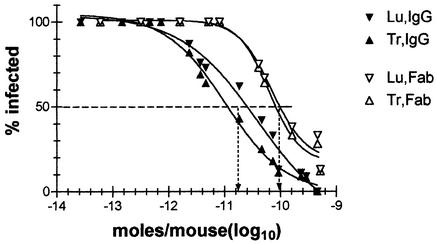
FIG. 3.
Therapeutic activity of i.n.-administered IgG and Fab. SCID mice were inoculated i.n. with ∼60 MID50s of PR8 in 20 μl of PBS and 3 h later with various doses of IgG (solid symbols) or Fab (open symbols) in 30 μl of PBS. Seven days later, trachea (Tr) and lung (Lu) were tested for presence of infectious virus. Seven experiments were performed. Together, they comprised 41 and 29 mice treated with IgG and Fab, respectively. The percentage of infected tissues was calculated from the cumulative number of infected and noninfected tissues at the given dosage. Trachea and lungs are indicated by triangles pointing up and down, respectively. Sigmoidal curves were fitted to the each set of data with Prism software (GraphPad Software, Inc., San Diego, Calif.). The stipulated horizontal line shows the 50% clearance level, and the vertical arrows point to the average dose (in moles per mouse) of IgG and Fab at which 50% clearance was achieved.

