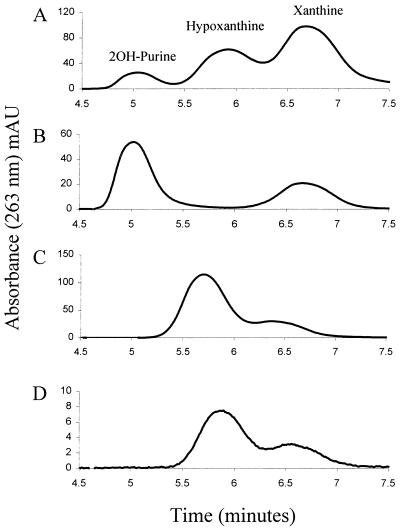
Figure 3.
HPLC analysis of purine and hydroxylated derivatives. Retention time is plotted versus absorbance at 263 nm, at which all of the tested purine derivatives have significant absorbance. Peaks that represent each compound from the standard are marked in A. (A) Standard mixture of purine, 2OH-purine, hypoxanthine, and xanthine. (B) PH incubated with 2OH-purine. (C) PH incubated with hypoxanthine. (D) PH incubated with purine. See Materials and Methods for further details.

