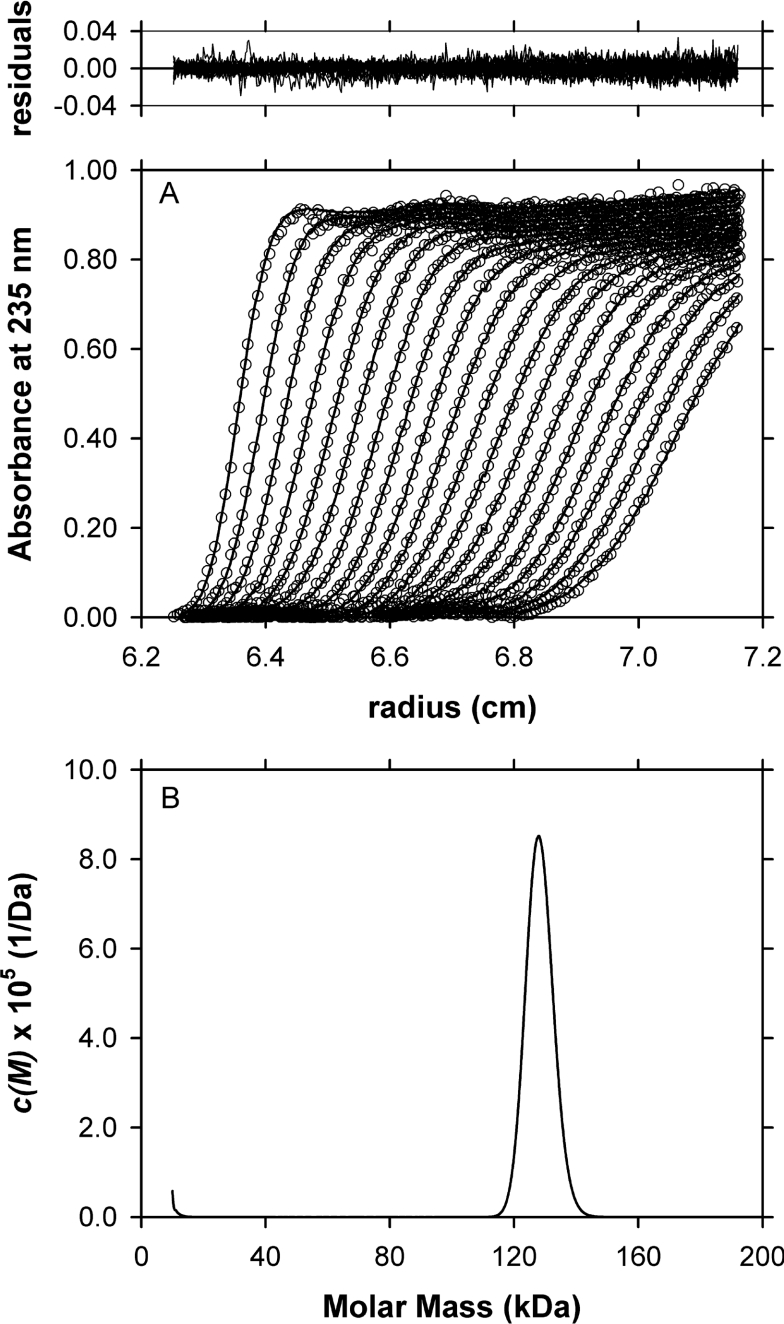
Figure 6. Sedimentation velocity analysis of T. maritima DHDPS.
(A) Absorbance at 235 nm plotted as a function of radial position from the axis of rotation (cm) for T. maritima DHDPS at a concentration of 0.5 mg·ml−1. The raw data are presented as open symbols (○) plotted at time intervals of 8 min overlaid with the non-linear least squares best fit (solid line) to a continuous size distribution model [46] as described in (B). (B) The c(M) distribution is plotted as a function of molar mass (kDa) for T. maritima DHDPS. The fit was obtained using a resolution of 200 species between Mmin of 10 kDa and Mmax of 200 kDa with v=0.743, ρ=1.005 g·ml−1, η=1.021 cp and f/f0=1.21. The rmsd and run test averages for the fit were 0.00657 and 14.4 respectively. Top: the residuals for the c(M) distribution best fit described in (B) plotted as a function of radial position (cm) from the axis of rotation.

