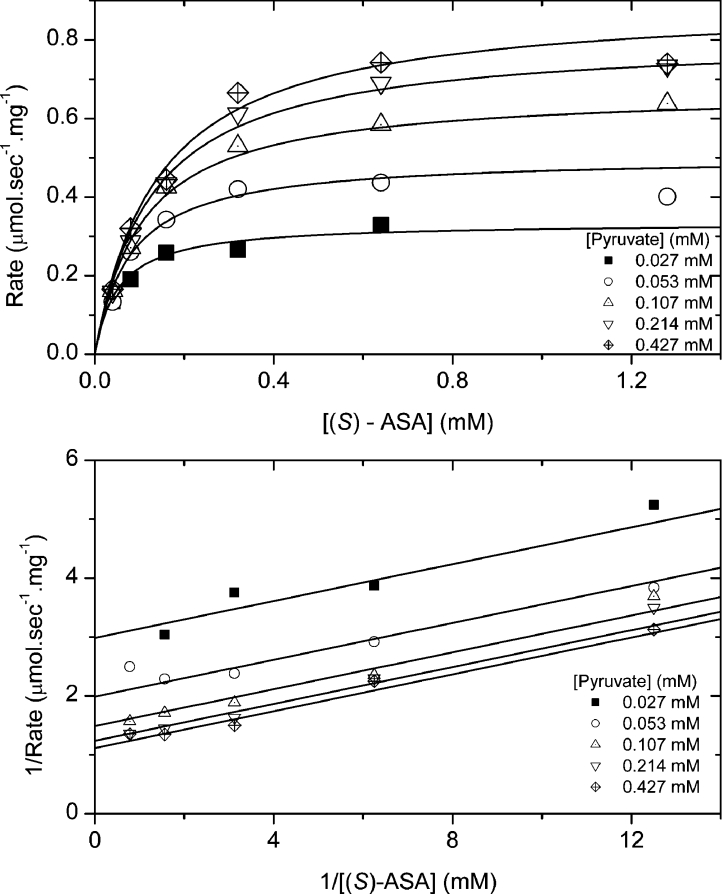
Figure 7. Kinetics of enzyme activity.
Initial velocity was measured at varying pyruvate and (S)-ASA concentrations. Each data point was measured at least in duplicate and data were fitted to the Ping Pong model [30] and the R2 for the fit was 0.960.

