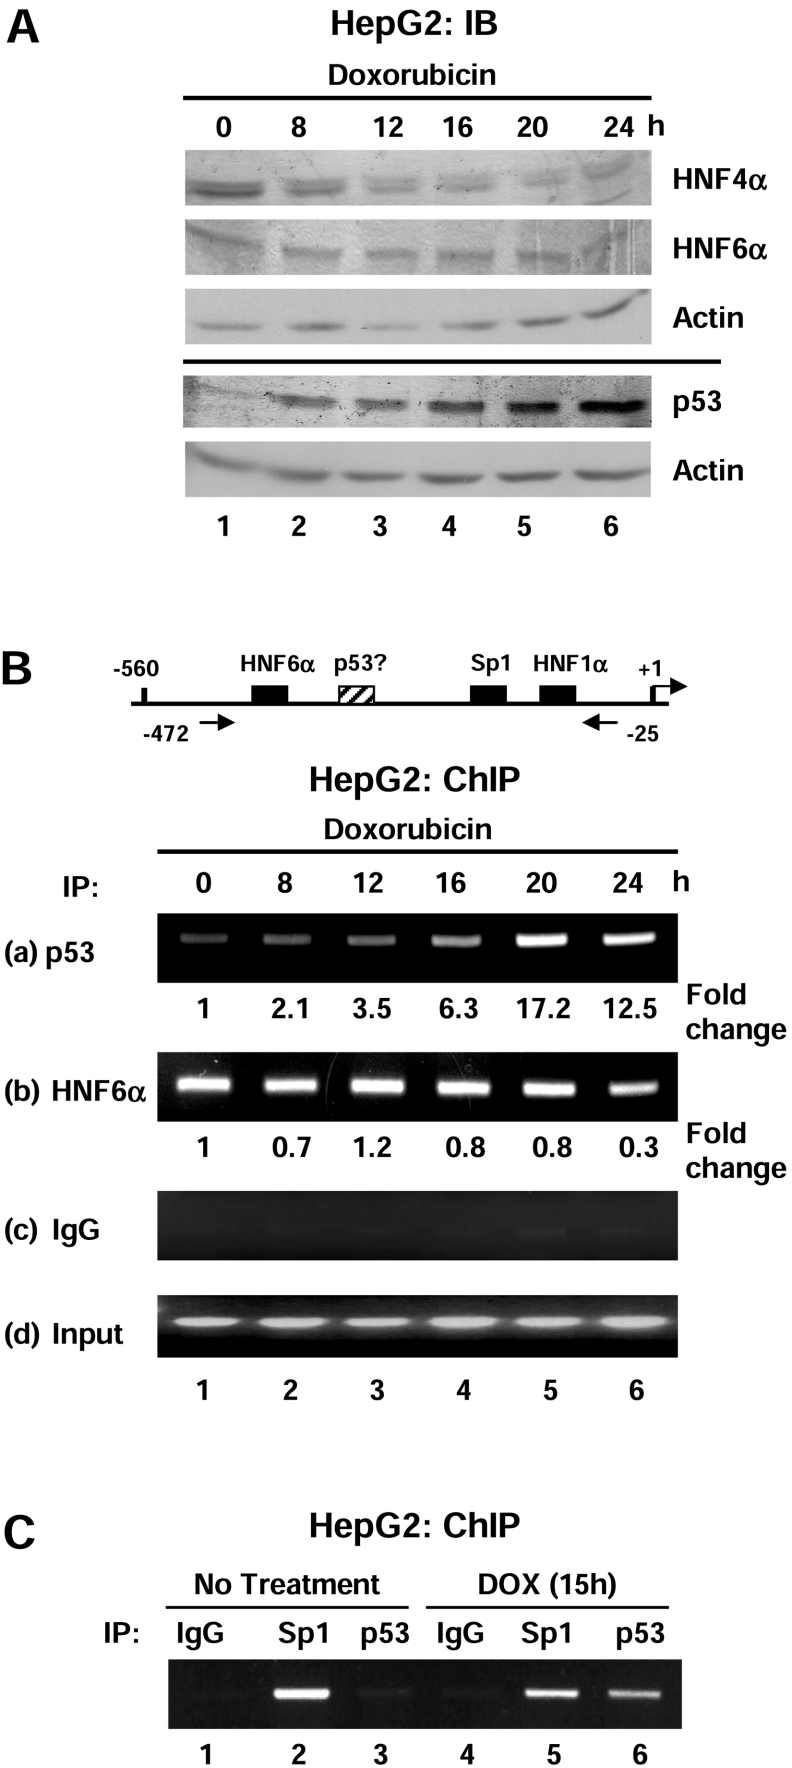
Figure 7. p53 and HNF6α bind the human HNF4α P1 promoter in vivo after doxorubicin treatment.
(A) IB (immunoblot) analysis using ECL® verifying an increase in p53 and a decrease in HNF4α, but no substantial change in HNF6α protein levels in HepG2 cells after doxorubicin treatment (1 μg/ml) over 24 h. Protein levels were analysed using antibodies against HNF4α (α-445), HNF6α (N-terminus), p53 (FL-393) and β-actin. The solid line separates two gels loaded with identical samples. (B) Upper panel: schematic diagram of the human HNF4α P1 proximal promoter showing the relative position of the PCR primers used in the ChIP assay. Lower panel: ChIP assay of HepG2 cells treated with doxorubicin (1 μg/ml) for 0–24 h using anti-p53 (FL-393, a), anti-HNF6α (H-100, b), control mouse IgG (c) and 10% input (d). The amount of p53 bound to the P1 promoter increased after doxorubicin treatment but there was no substantial change in the amount of HNF6α bound to the promoter. Shown are the ethidium bromide-stained agarose gels. The bands were quantified using the NIH (National Institute of Health) Image J program and the fold-change relative to 0 h (control, non-treated) was calculated and normalized to the input signal. Results are from one representative experiment of at least three that were performed. (C) ChIP assay as in (B) using an anti-Sp1 (PEP2) antibody.

