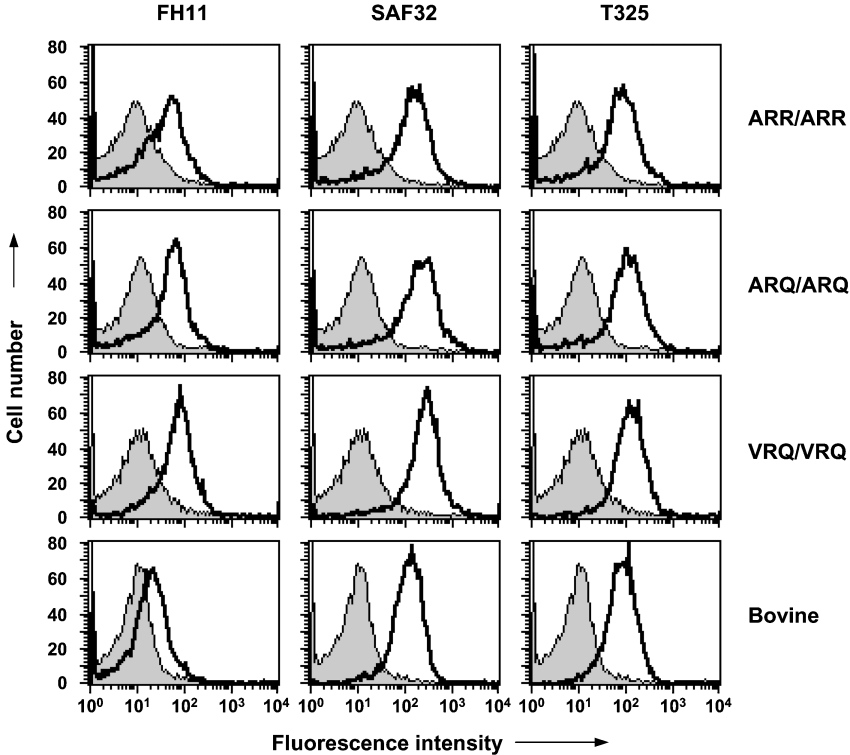
Figure 3. Reactivity of N-terminal-specific anti-PrP monoclonal antibodies with ovine and bovine PBMCs.
Cell-surface PrPC expression was analysed by FACS with N-terminal-specific anti-PrP monoclonal antibodies as described in the Materials and methods section. Profiles shown are representative of five out of five sheep. Shaded peak represents control fluorescence; black line represents FH11, SAF32 or T325 fluorescence.

