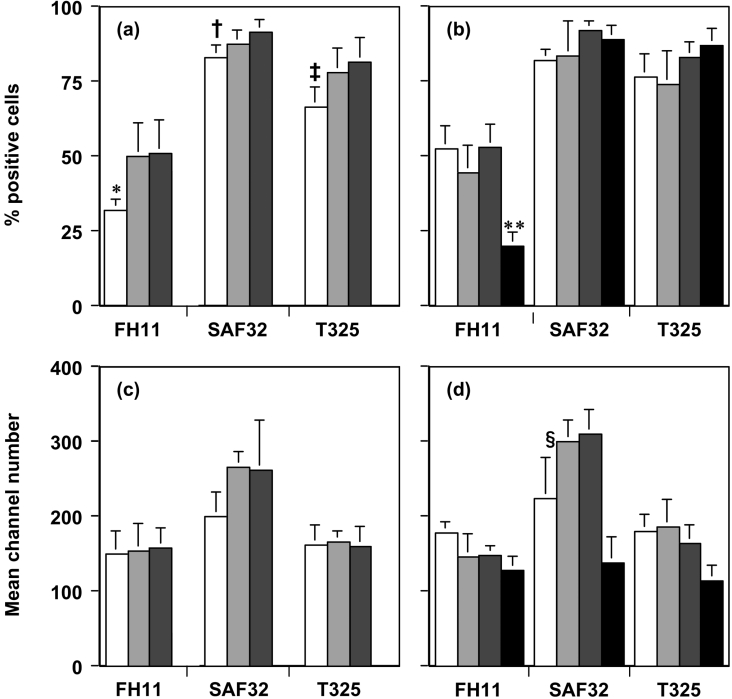
Figure 4. Quantification of N-terminal PrPC FACS analysis.
(a, b) Percentage of positive cells (means±S.D.) and (c, d) mean channel number (means±S.D.) are shown for PBMCs from homozygous ARR (white bar) (n=5); ARQ (light grey bar) (n=5) and VRQ (dark grey bar) (n=5) lambs (a, c) or PBMCs from homozygous ARR (white bar) (n=3); ARQ (light grey bar) (n=5) and VRQ (dark grey bar) (n=4) adult sheep (b, d) or bovine PBMCs (black bar) (n=8) (b, d) stained with N-terminal-specific anti-PrP monoclonal antibodies FH11, SAF32 or T325. *P<0.05 (comparison with ARQ and VRQ); †P<0.05 (comparison with VRQ); ‡P<0.05 (comparison with VRQ); **P<0.001 (comparison with SAF32 and T325); §P<0.05 (comparison with ARQ and VRQ).

