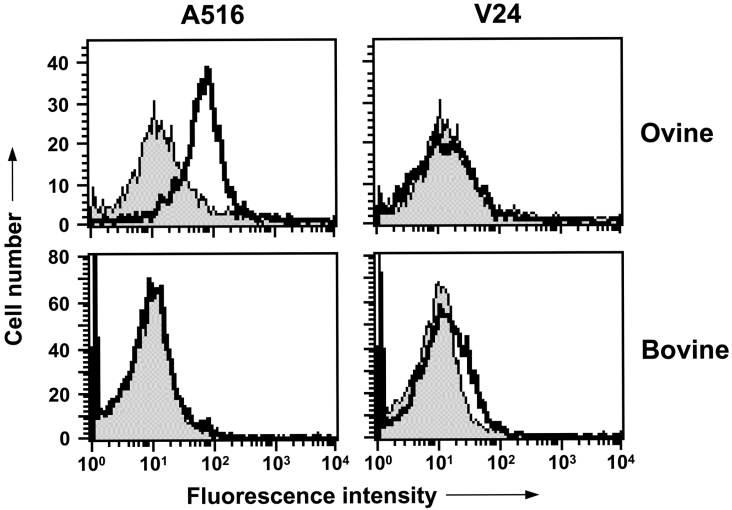
Figure 5. Reactivity of C-terminal-specific anti-PrP monoclonal antibodies with ovine and bovine PBMCs.
Cell-surface PrPC expression was analysed by FACS with C-terminal-specific anti-PrP monoclonal antibodies as described in the Materials and methods section. Profiles shown are representative of five out of five homozygous VRQ sheep and eight out of eight cattle. Shaded peak represents control fluorescence; black line represents A516 or V24 fluorescence.

